Understand and explore the power of scientific programming
Exploring graphical representation of scientific data with C
This short article demonstrates how to use C language in graphical representation of scientific data.
PROGRAMMING
Rahul Mahajan
8/27/20253 min read
Introduction
Almost all modern computing languages support graphical representation of scientific data. In fact, one of the reasons of popularity of languages like Python, R, Julia, MATLAB is their extraordinary graphical plotting capabilities. Undoubtedly, C is simple, small yet extremely powerful programming language still widely used in scientific programming. It has maintained its legacy over fifty years.
One of the drawbacks of using C language for scientific programming on modern machines is the lack of native plotting support. This is perhaps due to the reason that, the era in which this language came into existence was too old. Computer technology at that time was not as sophisticated for handling graphics as it is at this moment of time.
This article demonstrates how to overcome this limitation of lack of graphical support of C. In this article, we are using gnuplot along with C language for graphical representation of scientific data.
While writing this article, Windows x64 machine is used. How ever, this discussion is equally applicable for Linux based system. Only the difference is in the way of installations of programs on Linux platform.
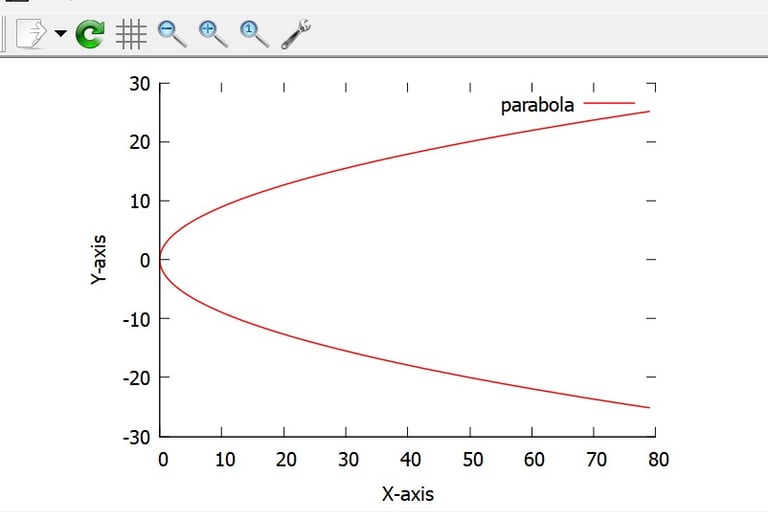
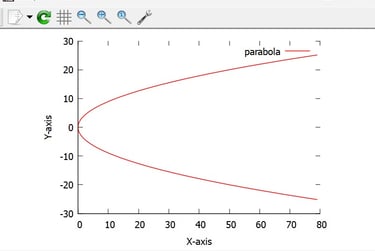
Consider an example of plotting a parabola with parametric equations given by

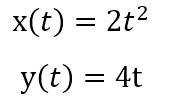
Let’s use C language along with gnuplot for this problem.
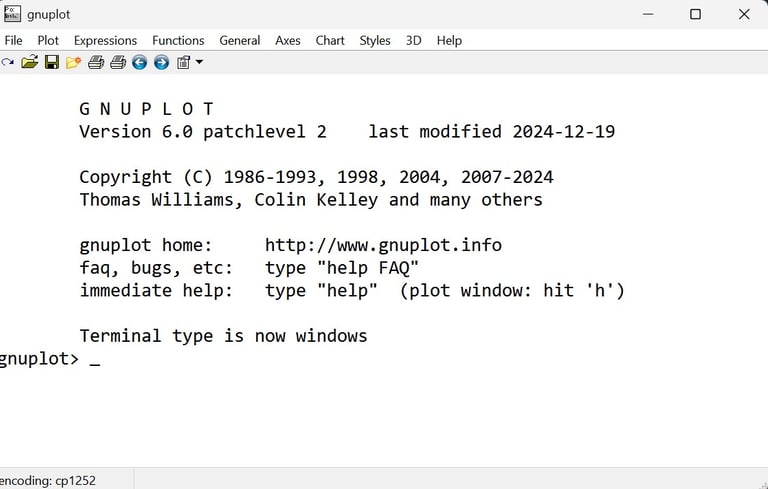
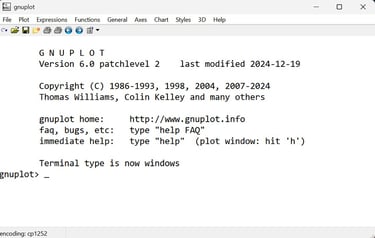
You can download gnuplot from here. While installing, be sure to select the option that says, "Add application directory to your PATH environment variable." Post successful installation, you can invoke gnuplot from start menu programs. The standard window of gnuplot shall look as follows.
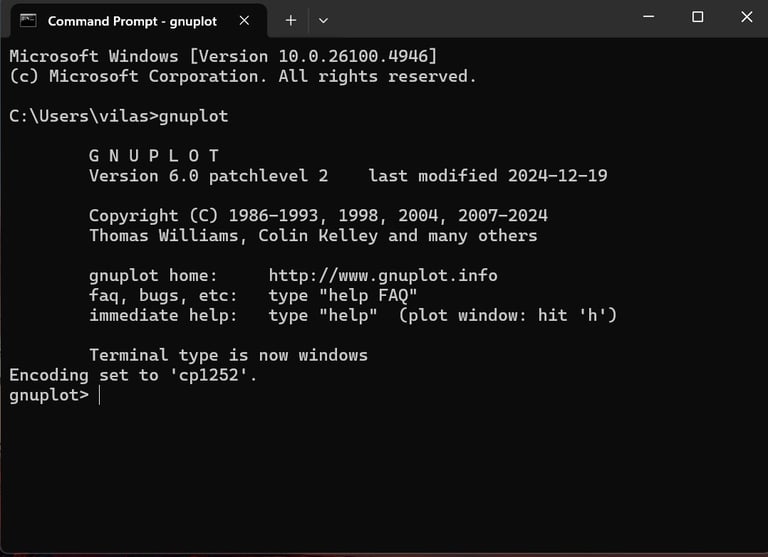
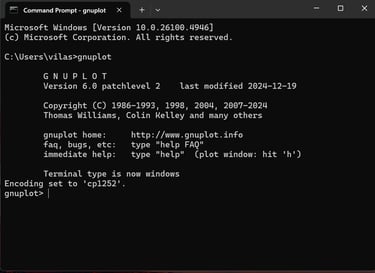
Alternatively, the console version of gnuplot can be invoked via terminal, just by typing gnuplot in terminal. If program is successfully added to PATH environment variable, then the following window should appear immediately without any problem.
Now, run the following C program with your preferred IDE. I am using Red Panda C++. You can use any IDE which you are comfortable with. (You can download C program from here.) If you are unable to read the program given below, please enable desktop site in your mobile browser.
#include <stdio.h>
#include <stdlib.h>
#include<strings.h>
#include<math.h>
int main() {
// Open a pipe to Gnuplot using pipe pointer
FILE *pp = popen("gnuplot -persistant", "wb"); // pp = pipe pointer to gnuplot
if (pp == NULL) {
fprintf(stdout, "Could not open pipe to Gnuplot.\n");
exit(1);
}
// Commands for gnuplot
char C[][80] = {"set style data lp",
"set parametric",
"set terminal qt",
"set trange [-2*pi:2*pi]",
"x(t) =2*t*t",
"y(t) = 4*t",
"set border 3",
"set xlabel 'X-axis'",
"set ylabel 'Y-axis'",
"plot x(t),y(t) title 'parabola' lw 1.5 lc rgb 'red'",
""
};
// Send commands to Gnuplot
int i = 0;
while (strlen(C[i]) != 0) {
fprintf(pp, C[i]);
fprintf(pp, "\n");
i++;
}
// Close the pipe
pclose(pp);
return 0;
}
The result of execution of the program is shown below.
Before concluding this topic, I would like to mention here that, even if you don’t know C programming or gnuplot or any of them, just don’t worry. All the articles that I am posting on this blog page are written as preamble to Scientific Programming. Hence this short article is just to introduce you about use of gnuplot and C language in graphical representation of scientific data. Hope you enjoyed it.
Leave a reply
scientificprogramming.in
Explore scientific programming
Contact author
© 2025. All rights reserved.